1. Introduction
If you are fortunate (maybe lucky), your electrochemical research may be as easy as placing three electrodes into a cell, filling the cell with an aqueous test solution (i.e., an electrolyte and your analyte of interest dissolved in water), and then simply running cyclic voltammetry to study your electroactive species. All too often, voltammetry is not quite this easy. One of the more common challenges you may encounter is the choice of and proper use of a reference electrode when working with a non-aqueous solvent (i.e., alcohols, dichloromethane, DMSO, THF, or acetonitrile).
All of the more common reference electrodes discussed in textbooks, such as the silver chloride (Ag/AgCl) or calomel (Hg/Hg2Cl2) reference electrodes, are based on aqueous chemistry and are not well suited for use with non-aqueous solvents. Contact between your test solution and the internal chemical solution within the reference electrode is made through a porous frit usually located near the bottom of the reference electrode. This frit, usually made from a porous glass or ceramic material, is an essential part of the reference electrode design. The frit allows the solution within the reference electrode to come into direct contact with your test solution while preventing significant mixing between the two solutions.
When the two solutions are in direct contact with each other within the pores of the frit, dissolved ions are free to travel from one solution to another. While this ionic mobility across the boundary between the two solutions is essential for electrical contact between the reference electrode and the other electrodes in the cell, the movement of ions can cause problems. For example, the internal solution within the silver chloride reference electrode contains an appreciable amount of chloride anions (Cl-), and these anions will diffuse through the frit into the test solution. If your analyte is sensitive to the presence of chloride (due to undesirable ligand exchange, poisoning of a sensitive electrocatalyst, etc.), using a silver chloride (or calomel) reference electrode will likely lead to a bad result.
A more troublesome problem can occur when an aqueous reference electrode solution comes into contact with a non-aqueous test solution. As ions from the aqueous reference electrode travel into the non-aqueous test solution, the solubility of these ions is very likely to be much lower in the non-aqueous solution. These ions may form precipitates within the pores of the frit, clogging the frit and cutting off electrical conductivity between the reference electrode and the other electrodes in the cell. Once the reference electrode is no longer in electrical contact with the test solution and the other electrodes, the potentiostat will quite literally begin operating with no reference point for measuring electrode potentials. The feedback amplifiers in your potentiostat will likely oscillate out of control, bouncing back and forth in a vain attempt control the working electrode potential.
To avoid clogged frits and other issues with aqueous reference electrodes, most electrochemical experiments involving a non-aqueous test solution make use of a pseudo-reference electrode. The psuedo-reference electrode design may or may not include a frit, but more importantly, it will usually be based on the same (or similar) electrolyte solution as your test solution. The simplest of all pseudo-reference electrodes is a plain silver wire inserted directly into your test solution. More sophisticated pseudo-reference electrode designs are also available from Pine Research.
The exact potential of a pseudo-reference electrode is not easily knowable from one day to the next or from one solvent system to the next. The potential of a pseudo-reference electrode must be established indirectly, usually by adding an electrochemically active “internal standard” compound to the test solution. The well-behaved ferrocene/ferrocenium redox couple is one of the more popular internal standards. Reporting the potential of the redox wave for your analyte with respect to the potential of the redox wave for the internal standard allows you to account for the drift and uncertainty associated with using a pseudo-reference electrode. By anchoring your potential measurements to a commonly used internal standard, the position of redox features from your non-aqueous voltammetry experiments can be compared to those reported by other researchers. This process is different than converting a potential axis from one standard reference electrode to another (see Reference Electrode Conversion Calculator).
Once you have a selected a suitable reference electrode, you may find that it’s not helpful to report your electrochemical data as potential vs. [arbitrary-and-exotic-reference-electrode-chemistry]. Or, you may want to compare your newly acquired results to other data acquired using a different internal standard. But, how do you do that? What exactly does this mean? This article aims to help you out with a simple example where the position of a voltammetric wave for a novel compound is reported as “potential versus Fc/Fc+” (ferrocene/ferrocenium).
2. Internal Standard Considerations
Below are some helpful diagnostic criteria used to select an appropriate internal standard for electrochemical experiments. This list does not cover all possible considerations, but it should give you a basic starting point.
- Popularity and Relevancy. Is the internal standard you are considering commonly found in prior scientific journal articles? While you can certainly use some exotic organometallic complex with fluffy ligands and extraordinary electrochemical behavior, would such a choice help others compare their own data with yours? Best to stick with something more ubiquitous.
- Cost and Availability. Does the internal standard you want to use have a high cost? Is it readily available in adequate supply?
- Solubility. The internal standard must be soluble in the same electrolyte solution as your analyte of interest.
- Electrolyte Compatibility. Be sure that the internal standard is chemically stable in the electrolyte solution. Sometimes this point is neglected, and only after committing some of your precious analyte to the electrolyte solution do you notice solid particles crashing out of solution.
Chemical and Electrochemical Compatibility. This one is pretty obvious – but do be sure that your internal standard does not either homogeneously (in solution) react with your analyte of interest or heterogenously (at the solution|electrode interface) react with your analyte (or its electrochemical products or the products of the other half-reaction at the counter electrode). - Separation of Redox Waves. The internal standard might be added to the test initially and be present throughout the entire experiment, or it may be added at the end of the experiment. In either case, you will be looking to see how far away (along the potential axis) the redox wave from your analyte is from the redox wave of the internal standard. If the two waves are right on top of each other, you are going to have a difficult time discerning their relative positions. Ideally you want to have at least 120 mV of separation between the two redox couples.
3. Example using Ferrocene as the Internal Standard
Ferrocene, 

Upon analysis with cyclic voltammetry, ferrocene gives a nearly reversible, classic duck-shaped voltammogram where the peak separation is typically between 55 – 65 mV. Ferrocene is not soluble in aqueous solution; therefore, its use as an internal standard is limited to select non-aqueous electrochemical experiments. Sometimes, you will see derivatives of ferrocene used where ligands were substituted with aqueous soluble species like (ferrocenylmethyl)trimethylammonium [FcTMA+] or ferrocenecarboxylic acid [FcCOOH]. Here, let’s assume we have used pure ferrocene in non-aqueous solvent.
For the purpose of illustration, we have used simulated electrochemical data with AfterMath Live in the following plots. Real world electrochemistry doesn't often look this good.
The important concept to understand here is that your potentiostat has absolutely no idea what chemistry is happening at your reference electrode. None (and it doesn’t matter). The potentiostat is simply providing constant potential feedback between the working electrode and reference electrode (and its chemistry, which sets the constant potential), and as a result, the peaks you observe are naturally referenced to the reference electrode itself (e.g., Potential vs. Ag/AgCl). The goal of this article, and perhaps of your need to plot your data vs. an internal standard like Ferrocene, is that you might be using a pseudo-reference electrode, whose potential can drift and is not constant; or, some exotic and uncommon reversible electrochemical couple in non-aqueous media (that nobody else, inspired by your work, can themselves reproduce). We haven’t even made a novel or interesting electrochemical measurement yet – but we are getting ready to, and it starts with understanding where ferrocene appears on the potential axis with the reference electrode you have chosen to use (whatever its chemistry is).
3.1. Cyclic Voltammetry of Target Species, A
Let’s assume that our true goal in the research is to interrogate the cyclic voltammetric response of some species, 

Species 

![\left[NBu_{4}PF_{6}\right]](https://s0.wp.com/latex.php?latex=%5Cleft%5BNBu_%7B4%7DPF_%7B6%7D%5Cright%5D&bg=ffffff&fg=58595b&s=0&c=20201002)
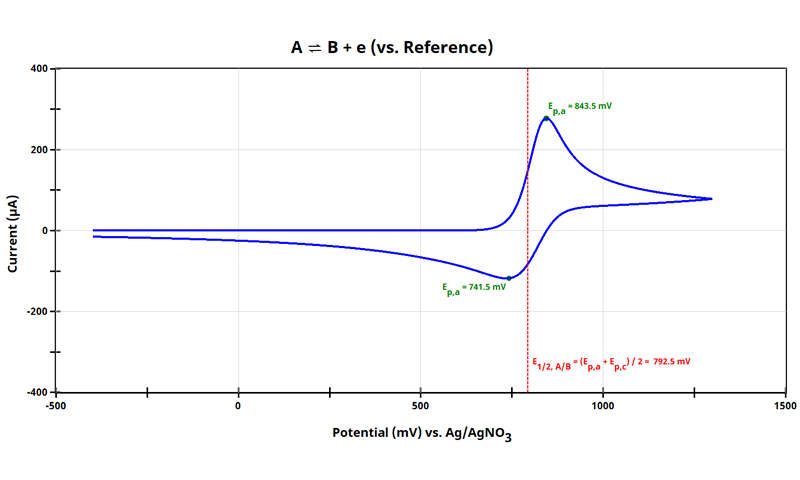
Cyclic Voltammogram of the A/B Redox Couple
It might be practical to stop at this point, as you have obtained what you need. But in many cases a cyclic voltammogram of this species when the potential axis is vs. Ag/AgNO3 may not be helpful for comparison reasons. Maybe you want to compare your data to something found in a journal, or to previous work, where the potential axis was relative to a different reference electrode or reference to an internal standard.
Notice in the plot above, the E1/2 can easily be calculated as:

where Ep,a is the anodic (oxidation) peak potential and Ep,c is the cathodic (reduction) peak potential. For the cyclic voltammogram of the
3.2. Cyclic Voltammetry of the Internal Standard with Reference Electrode
Having reviewed the considerations of what makes a good internal standard (see Section 2), ferrocene will be selected for this application. The internal standard E1/2 must first be determined and it is important to use the same reference electrode as with the species of interest (
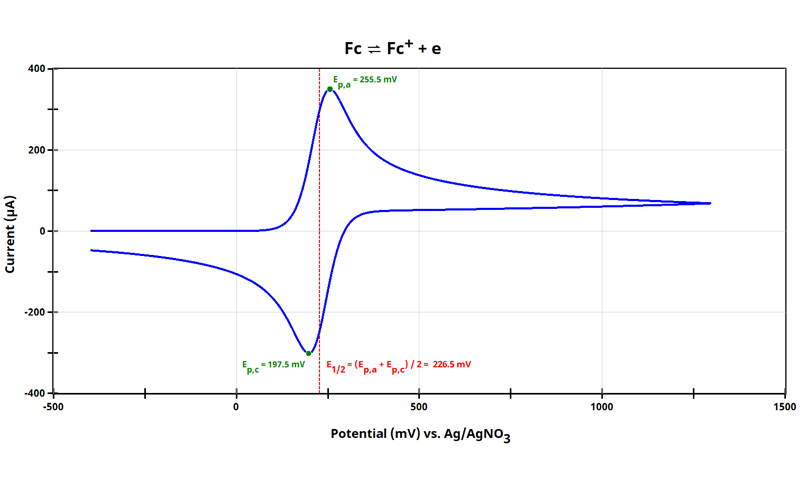
Simulated Ferrocene Cyclic Voltammogram Using Ag/AgNO3 Reference Electrode
For the cyclic voltammogram of ferrocene shown (see figure above), E1/2 = 226.5 mV vs Ag/AgNO3 and has been drawn in the dashed red line.
Think about this E1/2 value. One of the most critical aspects of the figure of merit is that its potential value is referenced to a real reference electrode, Ag/AgNO3 in this case. If it were possible to perform the same cyclic voltammogram with identical aspects except for a different reference electrode, say saturated calomel (SCE), then the of ferrocene would appear at a different potential vs. SCE. The separation and relative position of Ep,a and Ep,c would not change. The goal now is to use E1/2 vs Ag/AgNO3 as a basis for future measurements, where we will arbitrarily set E1/2 of the Fc/Fc+ couple to 0 mV vs reference. Often it is easier to understand this arbitrary potential axis shifting with figures.
3.3. Addition of Internal Standard to System Under Study
It is not always practical to always have your internal standard in solution (review considerations in Section 2); but for illustrative purposes, let’s consider exactly this case. If adding internal standard directly to your analyte is feasible for your research, do it and make your data manipulation easier.
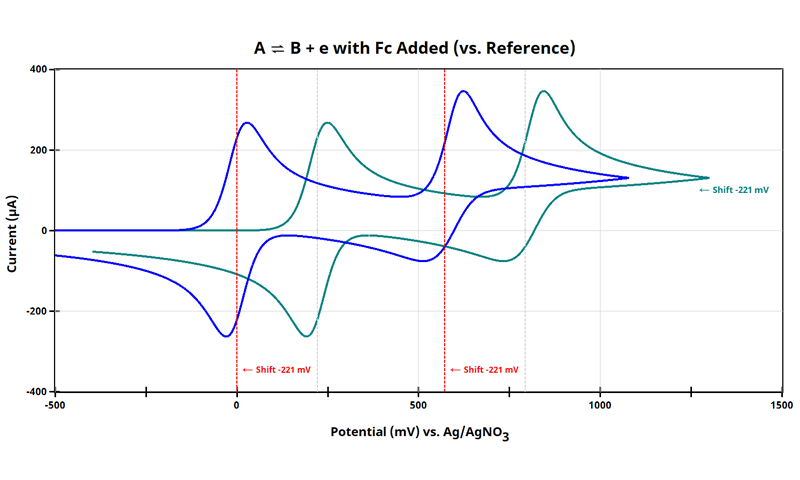
The combined cyclic voltammogram of 

Simulated Cyclic Voltammogram of Species A and Ferrocene Using Ag/AgNO3 Reference Electrode
Notice that in the combined cyclic voltammogram (see above Figure), the position of the internal standard Fc/Fc+ shifted 5 mV as compared to when the cyclic voltammogram of ferrocene alone was obtained (see earlier Figure). For many applications, this 5 mV shift is acceptable and will carry through when the potential axis for the 
At this point, all data in the cyclic voltammogram (see earlier Figure) are referenced to potential vs. Ag/AgNO3. When referencing cyclic voltammetry data vs. internal standard, arbitrarily set the E1/2 of the internal standard to 0 V. As shown above (see Figure above), E1/2 of ferrocene is +221 mV vs. Ag/AgNO3; therefore, subtract 221 mV from all points:
Adjustment of Potential Axis Relative to Internal Standard (Ferrocene)
Now, E1/2 for the Fc/Fc+ redox couple is at 0 mV, and the E1/2 for the
- If your electrochemical software includes handy tools, use them to adjust the axis. In AfterMath and AfterMath Blue, subtract 221 mV from all x-data (right-click trace, Apply Transform > Basic Math Operations)
- Export your data and manually adjust the potential axis by subtracting 221 mV from each point
AfterMath and AfterMath Blue software are free to download and use with most features - even useful for data you have acquired on other brand potentiostats. Give it a try today!
That’s it! Now, the cyclic voltammogram for the
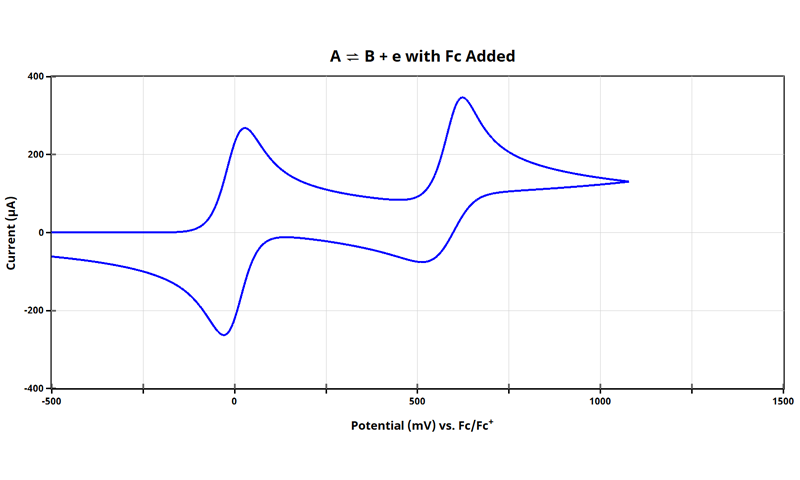
Cyclic Voltammogram of Redox Species A/B vs. Fc/Fc+
